App Analytics Reveal Shifting Habits in Soccer Betting and Horse Racing Platforms
Erik Zimmermann · Aug 6, 2026
App Analytics Reveal Shifting Habits in Soccer Betting and Horse Racing Platforms
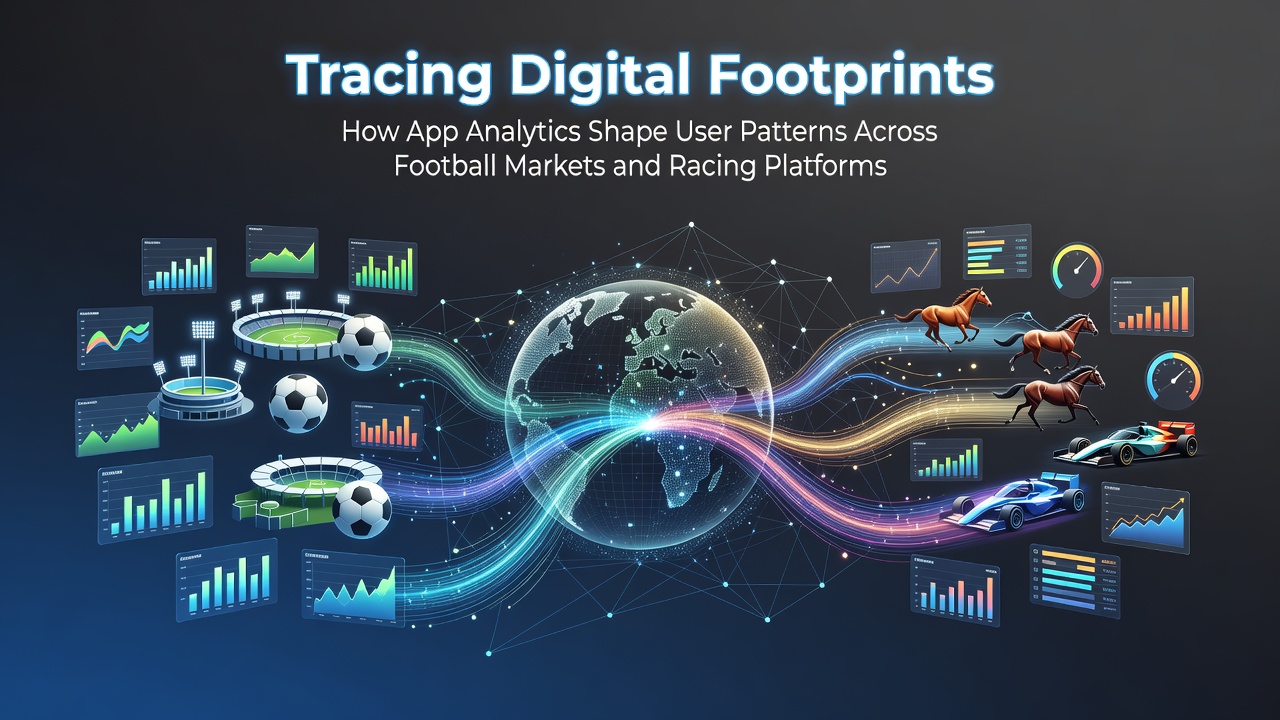
App analytics now trace user interactions across football and racing platforms with increasing precision, capturing everything from session duration to specific market selections. Data collected through these tools shows how bettors navigate live odds, explore player statistics, and switch between football accumulators and racing exotics. In August 2026 platform operators reported measurable changes in engagement patterns that align with broader shifts in mobile usage worldwide.
Core Mechanisms Behind Digital Tracking
Analytics suites embedded in betting applications record clicks, scrolls, and dwell times on individual screens, then aggregate those signals into behavioral profiles. These profiles highlight which football leagues draw the longest sessions and which racing meetings prompt the most rapid bet placements. Researchers at institutions focused on digital commerce note that such granular logs allow operators to identify emerging preferences without relying solely on deposit or withdrawal figures.
Session heat maps further illustrate where users pause before confirming wagers, revealing hesitation points around certain handicap lines or place markets. When combined with device and location metadata, the resulting datasets paint a detailed picture of how geographic factors influence activity on any given day.
Football Market Dynamics Under Analytics Scrutiny
Football sections within major apps generate high volumes of in-play activity, and analytics track the sequence of markets users visit after the opening whistle. Observers have documented consistent movement from match-winner selections toward over-under totals as games progress, a pattern visible across multiple European leagues. Data from August 2026 indicated that users accessing apps during evening kickoffs spent longer examining player performance overlays than those logging in during afternoon fixtures.
Cross-league comparisons become feasible when analytics tag every market view, exposing whether Premier League interest correlates with increased activity on lower-division matches later the same evening. Operators use these correlations to adjust promotional displays in real time, presenting relevant football content to users whose histories suggest a preference for specific competitions.
Racing Platforms and Pattern Recognition
Racing applications capture navigation paths from form guides to tote pools and from race replays to exacta combinations. Analytics reveal that users frequently switch between jockey statistics and track condition reports immediately before placing bets, a sequence that appears more pronounced on days featuring major meetings. Reports compiled in August 2026 showed elevated dwell times on pace analysis tools during wet-weather cards compared with firm-ground events.
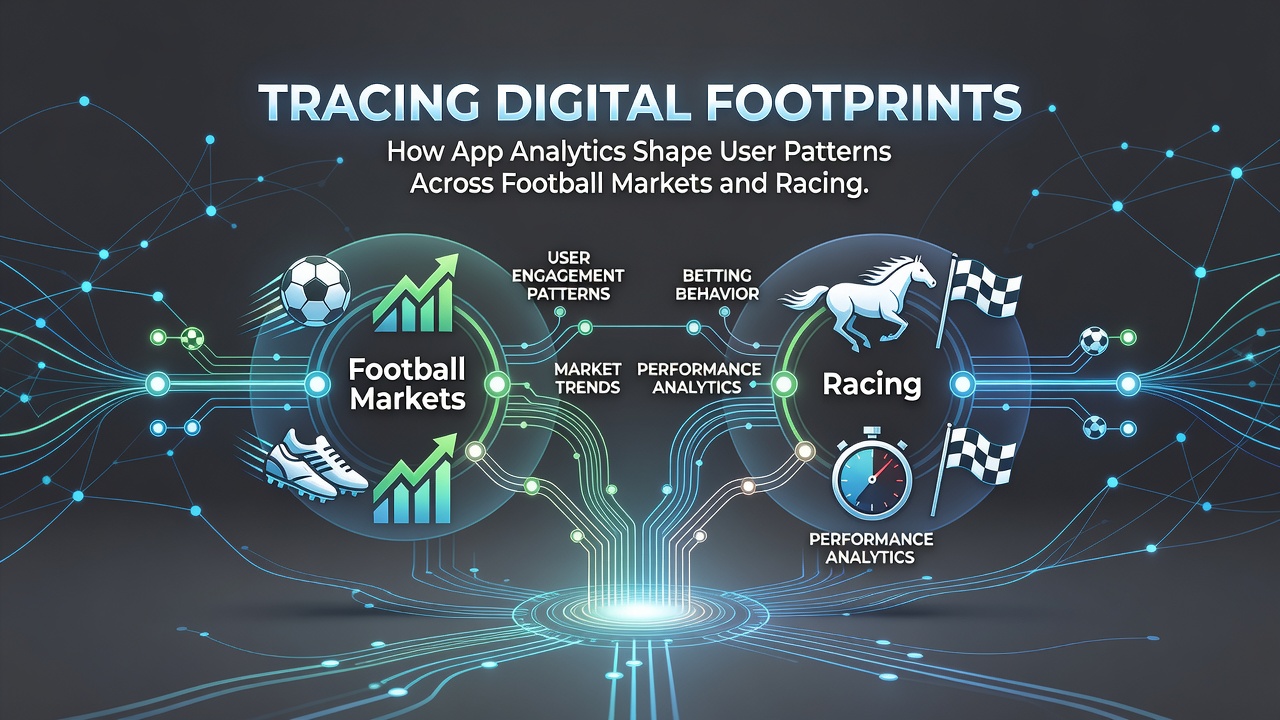
Multi-race wagers generate distinct footprints because users often build tickets incrementally, adding legs over several minutes. Analytics tools timestamp each addition, allowing platforms to detect whether bettors favor certain exotic structures during specific race types. Those who study these logs note that late surges in trifecta activity sometimes precede changes in tote dividends, providing operators with early signals of shifting market sentiment.
Cross-Platform User Journeys
Many users move between football and racing sections within the same session, and analytics capture these transitions with timestamps and market tags. One documented pathway involves checking live football scores before moving to evening racing cards, a route traced across thousands of accounts in mid-2026. Such movement patterns help platforms sequence notifications and content blocks so that relevant racing information appears shortly after football engagement peaks.
According to findings published by the International Gaming Institute, users who alternate between the two verticals exhibit longer overall session lengths than those who remain in a single category. The institute's research draws on anonymized logs supplied by operators in multiple jurisdictions, offering a broader view than single-market studies.
Regulatory and Industry Data Sources
Additional context comes from reports issued by the Australian Gambling Research Centre, which examined how mobile analytics intersect with responsible gambling tools in racing and sports apps. The centre's 2026 update highlighted increased use of session-limit features among users whose analytics profiles showed repeated late-night activity across both football and racing products.
These external datasets complement internal operator metrics, giving a fuller picture of how digital footprints evolve when users engage with multiple product types. Platform teams integrate the combined information into dashboards that surface anomalies, such as sudden spikes in certain market views that may warrant closer compliance review.
Conclusion
App analytics continue to map user patterns across football and racing platforms through detailed logging of navigation, market selection, and session timing. The resulting insights inform content placement and promotional timing while supplying regulators and researchers with aggregated evidence of behavioral trends. As August 2026 data demonstrated, these digital traces remain central to understanding how bettors allocate attention between the two verticals.